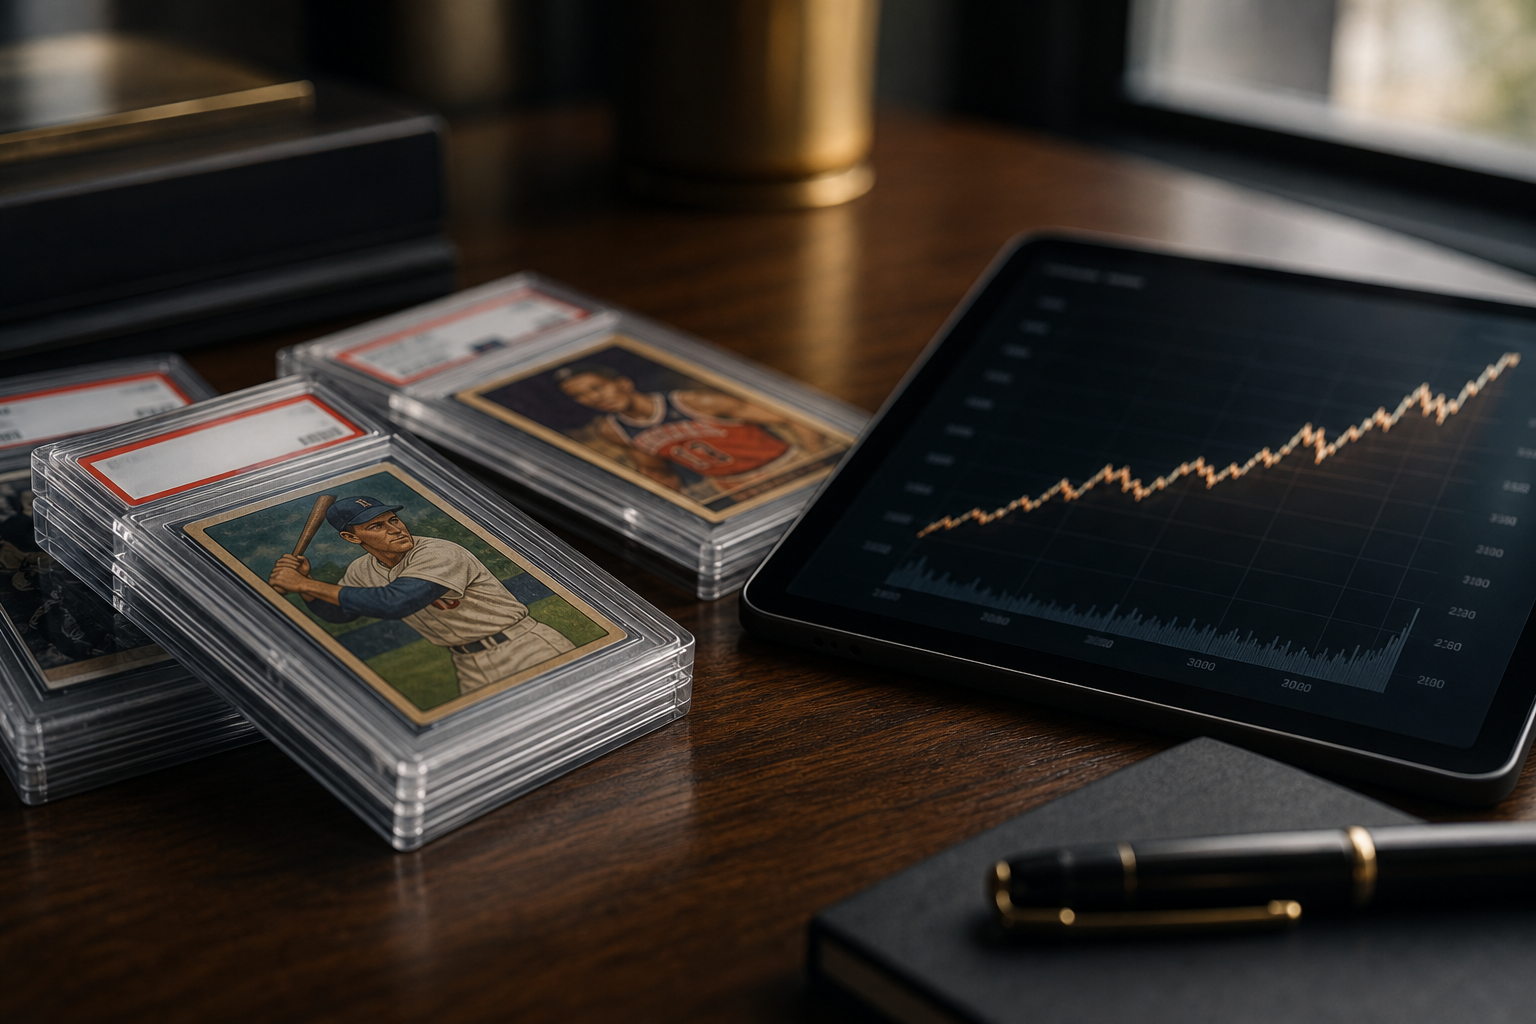
Research note: figures below are triangulated ranges from public industry and media sources (July 2026 synthesis). They are not investment advice. Prefer ranges over single-point “the market is $X” claims, and always name the market layer (factory TCG, sports cards, pack-rip commerce, and so on).
Executive summary
Collectible cards moved from a childhood hobby into a multi-billion-dollar alternative asset class — and then into a tokenized, influencer-driven commerce layer that mixes gaming mechanics, live selling, and institutional-grade custody.
This report is the Rips.xyz™ reference for collector-card TAM: how big the market is under different definitions, how sports cards and TCGs evolved, and how pack rips and on-chain RWAs changed the economics.[1]
Three forces defining 2026
- Vertical integration — Fanatics and Collectors Holdings span manufacturing, grading, live commerce, and vaulting.[2]
- Pack-rip / gacha as growth engine — live openings and repacks are estimated around $4.5–6.0B annually in pack-rip commerce.[3]
- RWA tokenization — Solana-native and related platforms vault graded cards and sell programmable claims; Collector Crypt alone has been cited near $330–400M monthly volume and about 80.8% of on-chain TCG share in mid-2026 media coverage of on-chain sector prints.[4][5]
Headline anchors
- Pokemon franchise lifetime revenue: $147B+
- Global trading cards: $15.8B (2024) → $23.5B (2030) at about 6.5% CAGR
- On-chain TCG: about $490M/month (Jun 2026)
- Record single-card sale: about $16.5M (Pikachu Illustrator PSA 10, Feb 2026)[6][7][8]
Bull catalysts and key risks
Bull catalysts include nostalgia spending, Pokemon’s 30th anniversary, consecutive on-chain gacha highs, and mainstream framing of collectibles as an asset class.[9][1]
Key risks include California grab-bag / lottery framing for sports repacks, grading-concentration scrutiny, margin pressure on leading on-chain venues, and post-launch decay in digital-only pack apps.[10][11][12]
Continue into Companies, EV tracker, and card history for operator dossiers, favorability literacy, and chapter-length timelines.
Economic history of collectible cards

Origins: the card as commerce
Collectible cards are older than the modern hobby. In the 1860s, U.S. tobacco companies inserted lithograph trade cards into cigarette packs as premiums — actresses, heroes, sporting figures — pocket-sized print meant to drive repeat purchases.
That same “pay, open, chase” loop is the ancestor of today’s pack-rip UX.[13]
By the 1880s, cigarette cards were a cultural phenomenon in the U.S. and U.K. Brands such as Allen & Ginter and Goodwin produced long series. The card was a loss leader for tobacco; collectors already traded and preserved them — an informal secondary market long before marketplace apps.
Sports-card golden age and grading
The modern sports-card mythology begins with the T206 Honus Wagner (1909–1911). Scarcity and authenticity turned a tobacco insert into a multi-million-dollar trophy asset.
Topps entered in 1951 with gum + card bundles; the 1952 Mickey Mantle cemented rookie-chase economics that still structure sealed and singles demand.[13]
Milestone timeline
- 1887 — early baseball cards in cigarette packs
- 1909 — T206 Wagner era
- 1952 — Topps Mantle template
- 1984 — Beckett price guides professionalize comps
- 1991 — PSA founds the modern grading era
- 1996 — Pokemon TCG launches in Japan
- 2020 — COVID boom; Collectors-index style series show extreme post-2020 appreciation in media coverage[14]
- 2026 — on-chain TCG volume cited above $490M/month[4]
Investment era (2020–present)
Lockdowns, stimulus, and crypto wealth pulled adult collectors back into childhood IP. Media citing Collectors index data described Pokemon card prices rising sharply through 2020 and then dramatically afterward; Card Ladder–style comparisons in regional press framed rare Pokemon returns against equity benchmarks.[14][15]
Trophy sales accelerated the narrative: Logan Paul’s Pikachu Illustrator path from multi-million to the about $16.5M AJ Scaramucci purchase (Feb 2026), plus eight- and nine-figure sports logoman headlines. Coverage also documented security hardening at shops as theft risk rose with price density.[7][16][17][1]
Tokenization wave (2024–2026)
From 2024, platforms vaulted graded physical cards and minted redeemable claims. Courtyard (Polygon) and Collector Crypt (Solana) popularized gacha-style openings with high buyback ratios versus fair-market references.
By June 2026, on-chain TCG sector volume near $490M/month (about 7.6× YoY in media summaries of on-chain sector prints) made “the rip” a programmable RWA business — with research noting that most RWA platform revenue still comes from openings, not pure P2P trading.[4][18][19]
Card form factor and distribution
The 2.5″ × 3.5″ card remains one of consumer history’s stickiest SKUs: it fits hands, binders, slabs, and vending coils, while supporting mass print economics and premium variants that push pack ASPs from single digits into hundreds of dollars.[20]
Retail and vending scale
Pokemon Company International scaled official U.S. grocery vending aggressively — on the order of 1,473–1,871 machines across dozens of states by 2026, with about 27% YoY network growth cited in trade coverage — enforcing MSRP, cashless checkout, and anti-scalper limits.[21]
Two distribution worlds
Distribution has split:
- Mass retail sealed product — grocery, hobby shops, official vending
- Live and digital openings — livestreams, Instant Rips, and digital packs, where opening is the product
Social tags around Pokemon cards accumulate enormous viewership that funnels into live-selling venues.[22]
Pack rips and influencer commerce
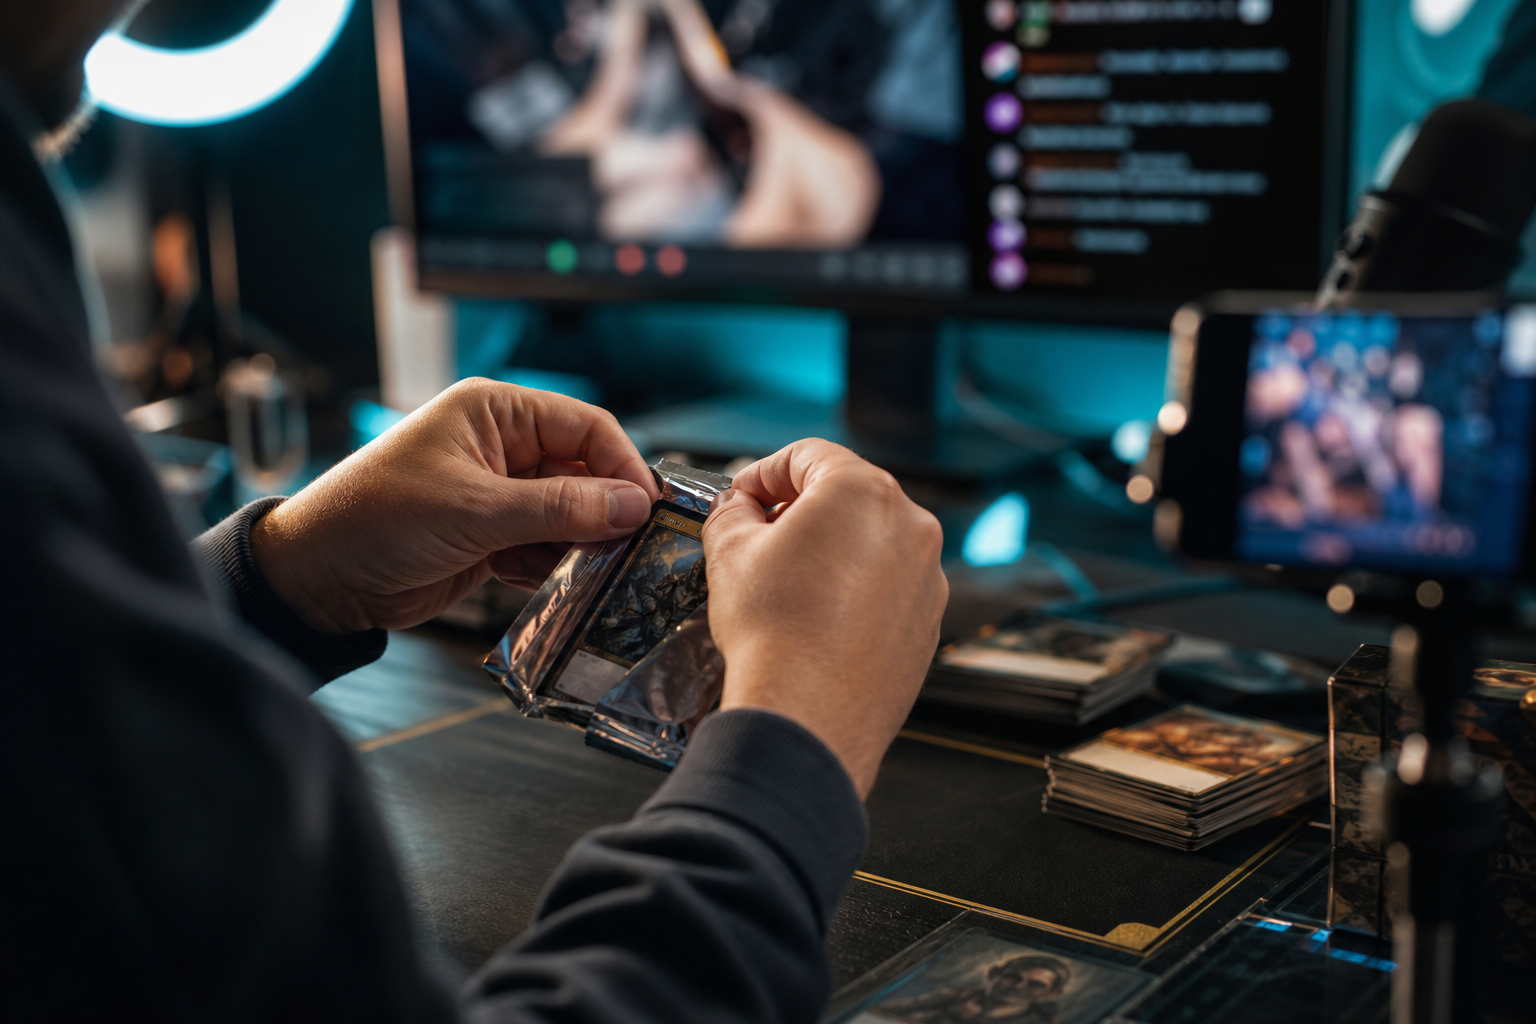
“Rip” started as breaker slang: open a sealed pack and ship the hits. COVID livestreams turned it into a category.
Whatnot is repeatedly cited near $8B GMV (2025) with sports cards and TCG among top U.S. categories — a cadence measured in cards per second on busy days.[3][22]
Buyers pay for the opening experience as much as for the finished card.
The mechanic is deliberately chance-adjacent: price + randomness + residual collectible value. Trade press compares repack EV thinking to gaming pay tables; platforms respond with odds disclosure and buybacks, while U.S. state statutes can still treat certain sports “grab bag” products as lotteries.[23][24]
Format taxonomy
| Format | What the buyer experiences |
|---|---|
| Rip & Ship | You buy a spot; a streamer opens and ships |
| Instant Rips | App/UI opens packs with high buyback liquidity |
| Live breaks | Shared box; slots sold by team/player/spot |
| Repack gacha | Non-factory sealed mystery products |
| On-chain gacha | Vaulted physical + token claim, often with buyback |
Related literacy: how it works, EV tracker, gacha games, Rip Virtual Packs.
How we size the market
“The card market” is not one number. Headlines can differ by 4–6× because researchers count different market layers — factory sealed product vs. secondary sales vs. live pack openings vs. on-chain claims.
A market layer is simply what dollars are included. Always name the layer when you cite a figure.[6][25]
| Layer | What it includes | 2025-style range | Later projection |
|---|---|---|---|
| Factory TCG | New sealed/licensed TCG from factory to retail | about $7.8B–$13.3B | about $15.8B–$27.6B |
| All trading cards | Broader card market; some studies primary-only, some add secondary turnover | about $14B–$30B | about $23.5B–$54B |
| Sports cards | Sports-specific primary + secondary | about $8B–$14.7B | about $24.7B–$28.6B |
| Pack-rip commerce | Live rips, breaks, Instant Rips, repack/gacha GMV | about $4.5B–$6.0B | about $8B–$18B (est.) |
| Tokenized RWA cards | Vaulted graded cards with on-chain claims | about $1.0B–$1.5B annualized | about $5B–$17.9B |
| Digital-only packs | Apps with no physical redemption (e.g. Pocket) | about $0.5B–$0.7B peak | Often post-launch fade |
How to read market-size headlines
Strategic Market Research’s oft-cited path is $15.8B (2024) → $23.5B (2030) at 6.5% CAGR; wider secondary-inclusive studies print larger totals.
Pack-rip commerce is still a tiny slice of global iGaming — the story is collectible spend expanding, not casino share capture.[6][25]
Continue with Analytics for on-chain series and Companies for operators.
Pokemon universe
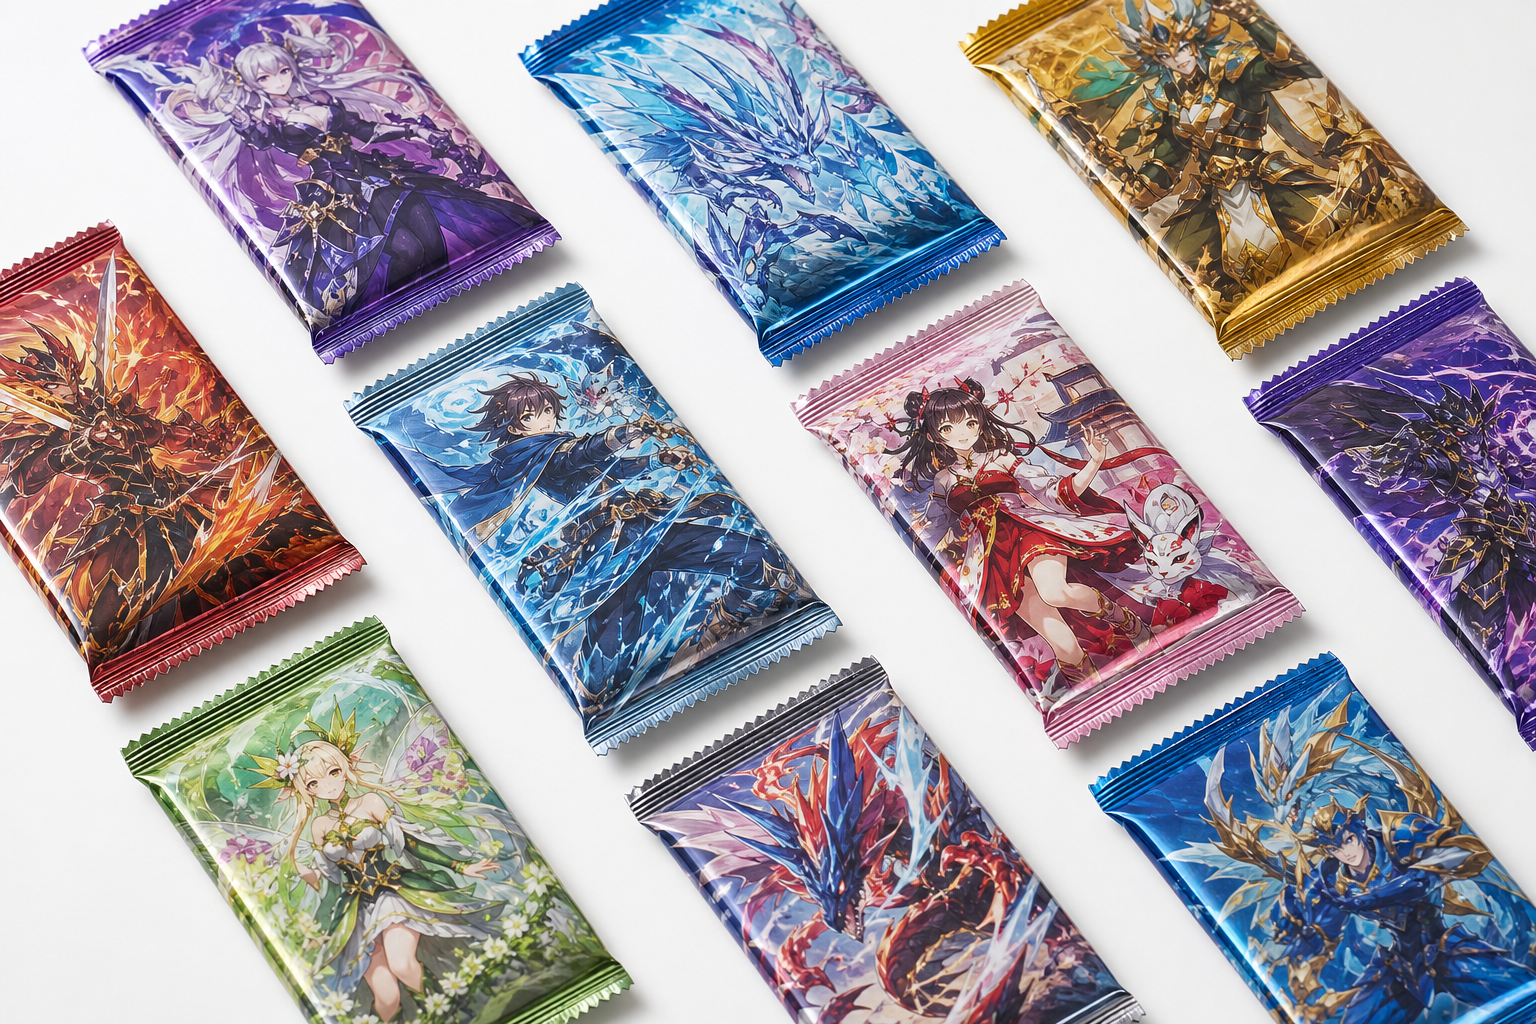
Pokemon is repeatedly ranked the top media franchise by lifetime revenue ($147B+), with TCG lifetime revenue near $30B and 85B+ cards printed — including multi-billion annual print runs in recent years.[26][27][28]
Timeline anchors
- Japan launch Oct 1996
- Wizards Base Set international 1999
- TPCi publishing transition 2003
- Pandemic Sword & Shield boom
- Pokemon TCG Pocket (DeNA + TPC) Oct 2024 — massive pre-registration and early revenue spikes
- 30th anniversary catalyst Sep 2026[29][12]
Regional demand
Japan’s domestic TCG strength (hundreds of millions of dollars in a single FY for Pokemon alone in cited Media Create figures) and APAC share of global TCG revenue underscore why Asian live commerce and secondary channels matter for TAM.[30]
Digital packs (Pocket) prove the opening mechanic can work at app scale — separate from physical RWA gacha.
Track sets and literacy on cards/pokemon and blog/pokemon.
Sports cards

Vertical integration
Fanatics’ post-Topps integration stacked licenses across major U.S. leagues and entertainment IP, with collectibles revenue cited near $1.6B (2024) and division targets around about $5B in 2026 commentary — inside a sports-collectibles sector often framed near about $100B in banker estimates.[2][31]
The stack spans manufacturing (Topps) → live Instant Rips → Fanatics Collect vault/auctions → retail.
Grading concentration
On grading, Collectors Holdings (about $4.3B private valuation in cited coverage) concentrates PSA/SGC/Beckett share — drawing antitrust attention as grading, comps analytics, and resale touch the same corporate family.[32]
Sports TAM printings vary: about $8B–$14.7B depending on U.S.-only vs global definitions.[30] North America still dominates sports-card revenue mix in most regional studies.
History chapters: sports cards, baseball cards.
Magic and broader TCG context
Magic: The Gathering remains the strategic tabletop TCG inside Hasbro (HAS) — a public-market proxy for TCG macro health even when Pokemon dominates consumer mindshare.[20]
Competitive TCG set
Competitive TCGs (Yu-Gi-Oh!, One Piece, and others) matter in Japan and APAC share math even when Pokemon alone out-earns several peers combined in domestic tallies.[30]
For catalog work use cards/mtg; for culture and reserved-list style premia see history/magic-cards and blog/markets.
Marketplaces and platform landscape
The stack mixes general secondary (eBay / TCGplayer), consignment, EU Cardmarket, premium auctions (Goldin/Heritage), Fanatics Collect, live commerce (Whatnot, Fanatics Live), and pack-rip RWA venues (Courtyard, Collector Crypt, Phygitals, and peers).[3][18][33]
Web2 × Web3 distribution
Courtyard’s $30M Series A (2025) and rapid GMV scaling, plus Phygitals × Fanatics Collect cross-listing, show Web3 inventory seeking Web2 distribution.[18][33]
Wallet-native experiments (e.g. Solflare Packs) push gacha into existing crypto MAU bases.[34]
Operator map on Rips: Companies. Settlement literacy: solana, custody guide.
Record sales and price discovery
Trophy comps set narratives more than they set medians.
The about $16.5M Pikachu Illustrator PSA 10 path (Logan Paul → Scaramucci) and eight-/nine-figure sports logomen taught mainstream media to treat slabs as high-value-density assets — with auction houses and eBay-owned Goldin as discovery venues.[7][8][1]
What comps do — and do not — tell you
Price discovery still depends on population reports, grading trust, and liquidity venue.
- For collectors: comps are not EV
- For operators: buyback oracles must not drift from real exit markets
Pair this section with EV tracker and Glossary.
Web3 and RWA tokenization

RWA card platforms vault physical graded inventory and issue transferable claims, usually with:
- Instant or near-instant buybacks (often cited in the 85–90% of FMV band)
- Gacha openings as the primary revenue engine
- Chain settlement (Solana heavily for Collector Crypt; Polygon historically for Courtyard)
Research summaries in 2026 stressed that openings — not secondary P2P — drive most platform revenue, confirming the rip-as-product thesis.[19][35]
On-chain TCG sector
On-chain sector prints (via crypto media) are the working thermometer:
- About $490M monthly on-chain TCG volume (Jun 2026)[4]
- Collector Crypt share often cited near about 80% of sector prints in the same windows[5]
- Cumulative volume and revenue milestones ($1B+ cumulative, tens of millions revenue) appear across CryptoBriefing / exchange research flashes[36][37]
- Bankless tracked consecutive gacha volume ATHs into mid-2026[9]
Treat on-chain prints as directional platform metrics — not factory TCG TAM.
Cross-check series on Analytics.
Investment exposure
There is no clean public pure-play for pack rips. Indirect tickers discussed in the source report:
| Ticker | Company | Card angle |
|---|---|---|
| 2432.T | DeNA | Pokemon TCG Pocket |
| HAS | Hasbro | Magic: The Gathering |
| EBAY | eBay | TCGplayer / Goldin liquidity |
| 2440.HK | MemeStrategy | Tokenized Pokemon fund (sentiment) |
Private market leaders
Private leaders capturing rip economics in cited valuations: Fanatics (about $31B), Whatnot ($11.5B), Collectors ($4.3B), Courtyard ($37.5M raised).[2][3][18]
Base-case narrative in the source: pack-rip commerce grows toward $8–12B by 2028 while tokenized RWA card flows expand — together a rising share of secondary activity — contingent on regulation and crypto cycles.
Risks and regulation
Primary risk vectors
- California Penal Code §319.3 — sports card grab-bag games can be treated as lotteries; Whatnot faces multi-party arbitration narratives in 2026 sports-press coverage.[10][24]
- EU digital fairness / PEGI trajectories raise disclosure and age-rating pressure on paid random mechanics.[29]
- Grading concentration — FTC attention on Collectors’ multi-brand grading stack.[32]
- Margin compression / whale concentration on leading on-chain venues.[11][5]
- Digital-only decay after launch hype (Pocket as case study).[12]
Scenario matrix
| Scenario | What it looks like |
|---|---|
| Bull | On-chain TCG toward $1B+/month; anniversary demand holds |
| Base | Mid-teens CAGR with rising compliance costs |
| Bear | Adverse lottery rulings + crypto winter |
2026–2028 outlook
The working thesis for the next two years is not “cards replace equities.” It is that more of secondary activity migrates into opening-led formats — live, Instant Rips, and tokenized gacha — while factory TCG product continues as the physical supply base.
What to watch
- Anniversary and print cadence in Pokemon (demand + supply timing)
- Lottery and disclosure outcomes in U.S. states and EU digital fairness rules
- On-chain share concentration — whether Collector Crypt peers take share or margins compress
- Grading and custody trust — the plumbing that makes trophy comps and RWA claims liquid
Pair this outlook with Companies for operator coverage and Analytics for sector series.
FAQ
What is TAM for collectible cards?
TAM is the dollar opportunity inside a named market layer. Factory TCG is not the same number as pack-rip commerce GMV. This page exists so collectors and researchers stop mixing those layers.
What is the difference between GMV and revenue?
GMV is goods changing hands; revenue is what the platform keeps. Live-commerce GMV can dwarf take-rate economics.
What is pack-rip commerce?
It is the opening-as-entertainment economy — breaks, Instant Rips, Rip & Ship, and gacha — estimated in the mid-single billions annually in 2025-style triangulations.[3]
How should beginners use this report?
Read history → learn the market layers → then use Companies and EV tracker for operators and odds literacy. Practice safely on Rip Virtual Packs / gacha games simulations.
Is on-chain volume the same as card TAM?
No. On-chain prints measure platform trading and openings for vaulted claims. They sit mainly in pack-rip commerce and tokenized RWA cards, not factory TCG shipments.
Citations
Superscript numbers in the report match this bibliography in order of first use (1–37).
Bibliography
- CNBC — Scaramucci collectibles as asset class, Feb 2026.
- CNBC — Fanatics collectibles market coverage, May 2026.
- Sacra — Whatnot revenue/GMV analysis, 2025.
- On-chain TCG sector data as reported via PANewsLab, HTX, KuCoin, MEXC (Jun–Jul 2026).
- HTX Insights — Collector Crypt on-chain analysis, Jul 2026.
- Strategic Market Research — Trading cards $15.8B (2024) path, 2024/2026 citations.
- BBC — Logan Paul / Pikachu Illustrator about $16.5M sale coverage, Feb 2026.
- Goldin / Yahoo Sports — Pikachu record sale, Feb 2026.
- Bankless — Tokenized gacha $324.6M ATH, Jun 2026.
- The Athletic — Whatnot gambling allegations, Mar 2026.
- AInvest — Collector Crypt margin erosion, Jul 2026.
- DeNA FY2025 / FY2026 operating results (Pocket).
- Card-research.org — Market consolidation research / historical synthesis.
- CNBC — Pokemon card boom / crypto / resale, May 2026.
- Straits Times — Pokemon cards as alternative investment, 2026.
- Bloomberg — Rare Pokemon Cards Fetch Millions, Jun 2026.
- Bloomberg — Pokemon Card Boom Crime Wave, Apr 2026.
- Fortune — Courtyard $30M Series A, Jul 2025.
- Memento Research — State of Pokemon RWA TCG.
- Hasbro Q1 2026 earnings release (Magic / collectibles commentary).
- Archyworldys / PokeBeach circuit — TPCi vending +27%, May 2026.
- Yahoo Finance — Whatnot $8B GMV, 2026.
- iGaming Today — Repacks as Gen Z gambling, 2026.
- California Penal Code §319.3 — Sports card grab-bag statute.
- Research and Markets — Wider trading-cards definitions (about $30B class), 2025.
- The Times — Pokemon as largest media franchise, 2026.
- Visual Capitalist — Top media franchises by revenue.
- Asia Business Daily — Charizard / RWA economics, Jun 2026.
- Mordor Intelligence — TCG market / Pocket revenue.
- DataIntelo — Sports / TCG regional market sizing, 2024–2025.
- MagicBlock — State of Onchain Collectibles, 2026.
- Illinois Law Review — Fanatics/Topps antitrust materials.
- Genfinity — Phygitals × Fanatics Collect, Apr 2026.
- PR Newswire — Solflare Packs × Collector Crypt, Jun 2026.
- Caggy Blog — RWA Trading Card Market Q1 2026.
- CryptoBriefing — Collector Crypt $1B volume, Jun 2026.
- CryptoBriefing — Solana on-chain TCG $1B, May 2026.
Additional reading
Sources from the underlying research document that are not directly cited above:
- Business Insider — Pikachu Illustrator auction, Feb 2026.
- KuCoin — Collector Crypt on-chain data flash, Jul 2026.
- MEXC — Collector Crypt monthly volume (on-chain sector prints), Jul 2026.
- PANewsLab — On-chain TCG sector analysis, Jul 2026.
- Solana Compass — Collector Crypt DAU commentary, Jun 2026.
- Sports Business Journal — Alt credit facility, Jul 2025.
- The Athletic — Breaker revenue scale, Jun 2026.
- Yahoo Finance — Tokenized Pokemon trades surge, Aug 2025.
- AInvest — CARDS token RWA revenue, Jun 2026.
- DataHorizzon — Collectible cards regional, 2024.
- ESPN — Box breaking / lottery analysis, 2026.
- Tokenized TCGs — Market size tracker.
- CoinGecko — Tokenized Pokemon platforms guide.
- Screenwise — Rip and Ship parental guide, 2026.
- Card-Codex — Rip and Ship dopamine economy, 2026.
Methodology
Market-size figures use triangulated ranges with explicit market layers. On-chain metrics are taken from third-party media summaries of sector terminals; verify primary sources independently when possible.
GMV ≠ revenue. Pack-rip commerce is estimated by triangulation because few vendors isolate it cleanly. Source URLs in the underlying research were accessed June–July 2026.